Note: Some of these tools require you to run as an administrator. ****
Autoruns
"This utility, which has the most comprehensive knowledge of auto-starting locations of any startup monitor, shows you what programs are configured to run during system bootup or login, and when you start various built-in Windows applications like Internet Explorer, Explorer and media players. These programs and drivers include ones in your startup folder, Run, RunOnce, and other Registry keys. Autoruns reports Explorer shell extensions, toolbars, browser helper objects, Winlogon notifications, auto-start services, and much more. Autoruns goes way beyond other autostart utilities." (official definition)
Note: This is a good tool to search for any malicious entries created in the local machine to establish Persistence.
Launch Autoruns.

Below is a snapshot of Autoruns, showing the first couple of items from the Everything tab. Normally there are a lot of entries within this tab.

Notice all the tabs within the application. Click on each tab to inspect the items associated with each.
The below image is a snapshot of the Image Hijacks tab. (At this time there is only 1 item listed)

ProcDump
"ProcDump is a command-line utility whose primary purpose is monitoring an application for CPU spikes and generating crash dumps during a spike that an administrator or developer can use to determine the cause of the spike." (official definition)

Alternatively, you can use Process Explorer to do the same.
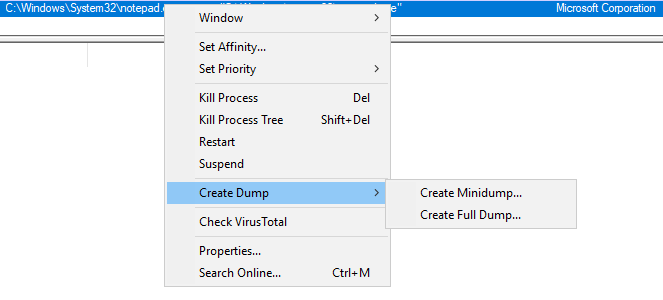
Right-click on the process to create a Minidump or Full Dump of the process.

Please refer to the examples listed on the ProcDump page to learn about all the available options with running this tool.
Process Explorer
"The Process Explorer display consists of two sub-windows. The top window always shows a list of the currently active processes, including the names of their owning accounts, whereas the information displayed in the bottom window depends on the mode that Process Explorer is in: if it is in handle mode you'll see the handles that the process selected in the top window has opened; if Process Explorer is in DLL mode you'll see the DLLs and memory-mapped files that the process has loaded." (official definition)
This tool was touched on slightly within the Core Windows Processes room. Process Hacker was intentionally used in that room to broaden your exposure to various tools that essentially perform the same tasks with subtle differences.
Since much of the basic foundational information was discussed in the Core Windows Processes room, Process Explorer will be briefly touched.
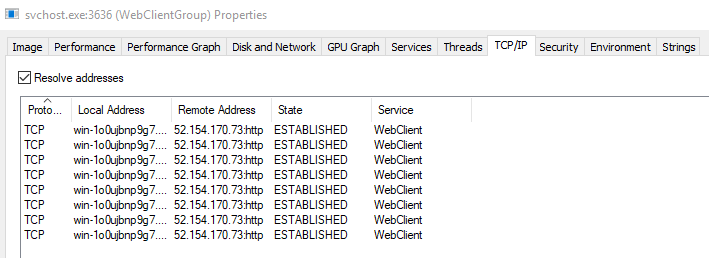
In the following images, let's look at svchost.exe PID 3636 more closely.


This process is associated with the WebClient service that is needed to connect to live.sysinternals.com (WebDAV).
There should be web traffic listed in the TCP/IP tab.

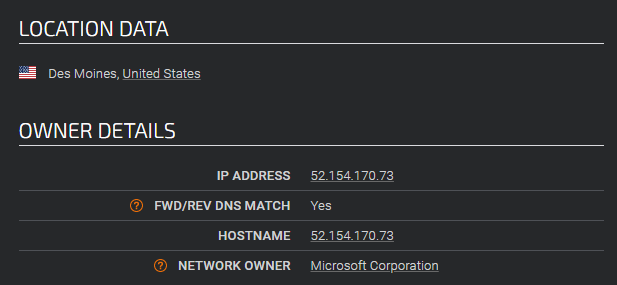
Ideally, it would be wise to check if that IP is what we assume it is.
Various online tools can be utilized to verify the authenticity of an IP address. For this demonstration, I'll use Talos Reputation Center.

https://talosintelligence.com/reputation_center/lookup?search=52.154.170.73
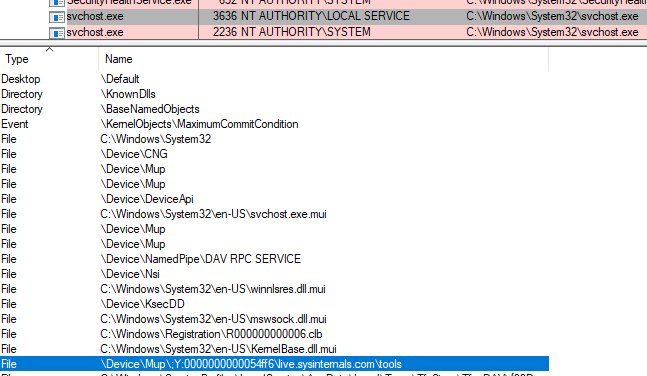
As mentioned in the ProcExp description, we can see open handles associated with the process within the bottom window.

Listed as an open handle is the connection to the remote WebDAV folder.
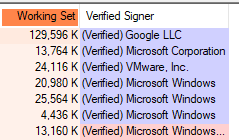
There is an option within ProcExp to Verify Signatures. Once enabled, it shows up as a column within the Process view.

Other options to note include Run at Logon and Replace Task Manager.
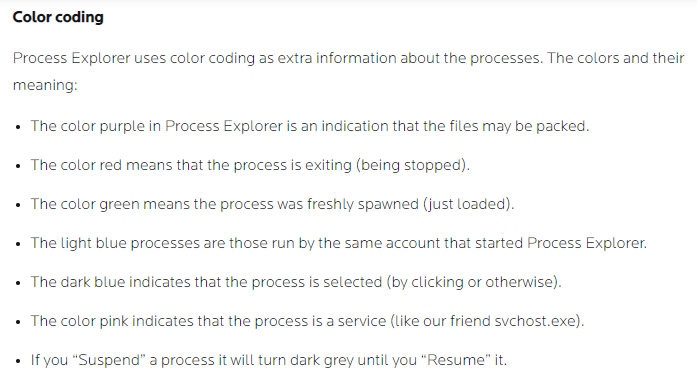
You may have noticed that some of the processes within Process Explorer have different colors. Those colors have meaning.
Below is a snippet from MalwareBytes explaining what each of those colors means.

Process Monitor
"Process Monitor is an advanced monitoring tool for Windows that shows real-time file system, Registry and process/thread activity. It combines the features of two legacy Sysinternals utilities, Filemon and Regmon, and adds an extensive list of enhancements including rich and non-destructive filtering, comprehensive event properties such as session IDs and user names, reliable process information, full thread stacks with integrated symbol support for each operation, simultaneous logging to a file, and much more. Its uniquely powerful features will make Process Monitor a core utility in your system troubleshooting and malware hunting toolkit." (official definition)
Launch ProcMon.

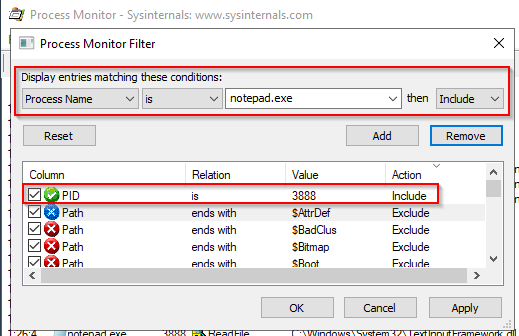
In the below snapshot, I set a filter to capture all the events related to PID 3888, notepad.exe. You can see some of the file operations that were captured and the file path or registry path/key the action occurred on, and the operation result.

ProcMon will capture thousands upon thousands of events occurring within the operating system.
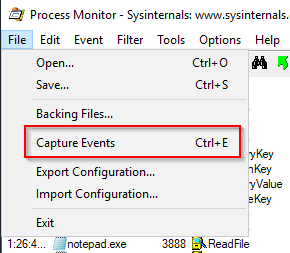
The option to capture events can be toggled on and off.

In this ProcMon example, the session captured events only for a few seconds. Look at how many events were captured in that short space of time!

To use ProcMon effectively you must use the Filter and must configure it properly.

In the above image, a filter was already set to capture events associated with PID 3888. Alternatively, a filter could have been set to capture events with the Process Name = notepad.exe.
Here is a useful guide on configuring ProcMon.
Note: To fully understand the output from some of these tools you need to understand some Windows concepts, such as Processes and Threads and Windows API calls.
PsExec
"PsExec is a light-weight telnet-replacement that lets you execute processes on other systems, complete with full interactivity for console applications, without having to manually install client software. PsExec's most powerful uses include launching interactive command-prompts on remote systems and remote-enabling tools like IpConfig that otherwise do not have the ability to show information about remote systems." (official definition)

PsExec is another tool that is utilized by adversaries. This tool is associated with MITRE techniques T1570 (Lateral Tool Transfer), T1021.002 (Remote Services: SMB/Windows Admin Shares), and T1569.002 (System Services: Service Execution). It's MITRE ID is S0029.
You can review this tool more in-depth by visiting its Sysinternals PsExec page. You can also check out this resource page.
Other tools fall under the Process Utilities category. I encourage you to explore these tools at your own leisure.
Link: https://docs.microsoft.com/en-us/sysinternals/downloads/process-utilities
Answer the questions below
Run Autoruns and inspect what are the new entries in the Image Hijacks tab compared to the screenshots above.
How to: No Answer Needed.
Answer: No Answer Needed.
What entry was updated?
How to: Use the command autoruns to open up the autoruns program. Now navigate over to the Image Hijacks tab and what program is visible on the VM that is now in the screenshot above? That program is the answer to this question.
Answer: taskmgr.exe
What is the updated value?
How to: Staying on autoruns Image Hijacks tab, find the file path for the answer above. That file path is the updated value and the answer to this question.
Answer: c:\tools\sysint\procexp.exe


